TL;DR / Key Takeaways
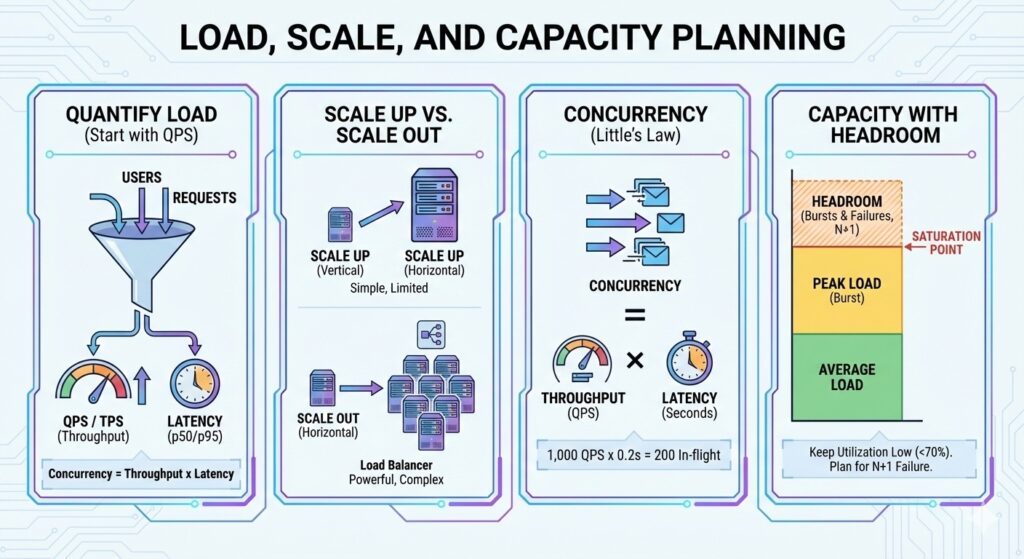
- Start with QPS, not servers. Quantify the load first.
- Concurrency is throughput times latency (Little’s Law).
- Scale up is simple but limited; scale out is powerful but complex.
- Always leave headroom for bursts and failures.
The Three Numbers You Always Need
- QPS or TPS: how many requests or transactions per second.
- Average and p95 latency: how long a request takes.
- Concurrency: how many requests are in flight at once.
A simple rule:
- Concurrency = Throughput * Latency (seconds)
If you do 1,000 QPS and average latency is 200 ms (0.2 s), concurrency is about 200 requests in flight.
Worked Example: Concurrency to Instance Count
Assume a peak of 2,500 QPS and p95 latency of 120 ms.
- Concurrency = 2,500 * 0.12 = 300 in-flight requests
- If one instance can handle 60 concurrent requests, you need 300 / 60 = 5 instances
- Add 30 percent headroom -> 6.5, round up to 7 instances
Utilization and Queueing Intuition
Systems behave well at moderate utilization and fall apart near saturation.
- Below 60 to 70 percent CPU, latency is stable.
- Above 80 percent, queues grow and tail latency spikes.
Capacity planning is not just about average QPS. It is about keeping utilization low enough to absorb bursts and failures.
Read vs Write Heavy Systems
Read-heavy systems can rely more on caching and replicas. Write-heavy systems need stronger write paths, idempotency, and careful data partitioning.
Key question: is 90 percent of your traffic reads, or writes?
Scale Up vs Scale Out
- Scale up: bigger machines, fewer nodes. Simple, fast to do, limited by hardware.
- Scale out: more machines. Better long-term but requires stateless services and distributed data.
graph LR
  Users --> LB[Load Balancer]
  LB --> S1[Service]
  LB --> S2[Service]
  LB --> S3[Service]
Trade-offs to State
- Scale up is simpler to operate but increases the impact of a single node failure.
- Scale out improves throughput but adds coordination overhead and data complexity.
- More headroom reduces risk but increases cost.
Capacity Estimation Workflow
- Estimate peak QPS (use 5x average if unsure).
- Estimate per-request cost (CPU, memory, IO).
- Size for p95 latency, not average.
- Add 30-50 percent headroom.
- Plan for a single node failure.
Worked Capacity Example
Assume a peak of 3,000 QPS. Each request uses 15 ms of CPU time.
- CPU needed per second = 3,000 * 0.015 = 45 CPU seconds
- At 70 percent utilization, required cores = 45 / 0.7 = about 65 cores
- With 8 vCPU instances, that is 9 instances, plus one extra for N+1 capacity
Round up to 10 or 11 instances to cover bursts and maintenance.
Storage and Growth Planning
Capacity is not only compute.
- 50 GB writes per day and 30 day retention = 1.5 TB raw data
- With 3x replication, plan for 4.5 TB storage
- Rebuild and backup windows must fit inside your maintenance budget
Failure Modes
Common failure modes:
- Hot keys or hot partitions overload a single node.
- Shared state blocks horizontal scaling.
- Dependencies throttle you even if your own service scales.
- Autoscaling reacts too slowly to sudden traffic spikes.
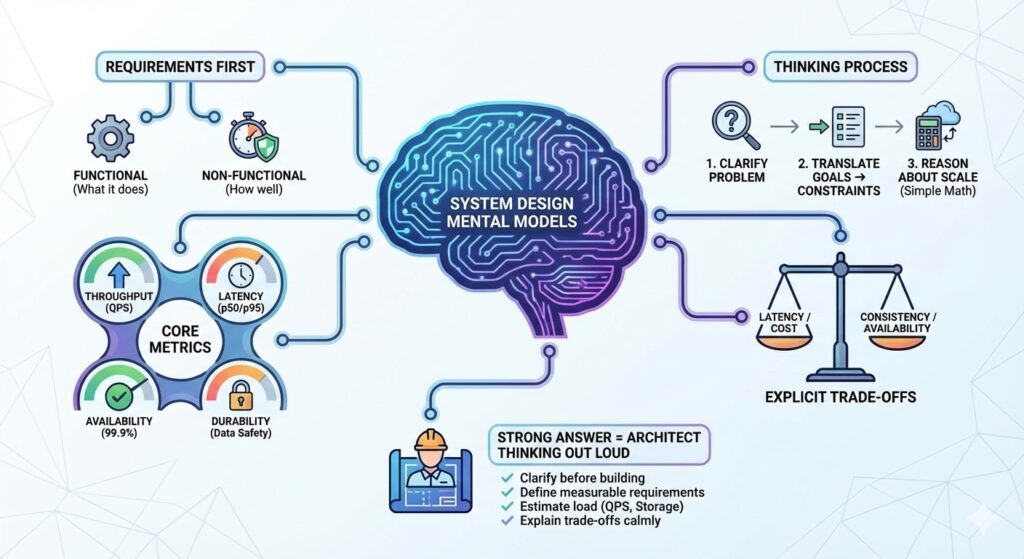
Practical Interview Framing
If asked to design for scale, say:
- “I will estimate the QPS and data size first.”
- “I will pick a baseline architecture and then scale it.”
- “I will add headroom for burst traffic and node failures.”
This shows you think in systems, not just components.
Quick Checklist
- QPS and peak multiplier estimated.
- Concurrency calculated from latency.
- Scale up vs scale out trade-off stated.
- Headroom and failure capacity included.